Friday, 24 April 2015

Harvard DNA Replication

Link to simulation

Introduction
Harvard's DNA replication simulation is an interactive animation which allows the user to look at how DNA replication works in a variety of ways. They are also able to stop and start the simulation and move back and forth as they need to. What is really excellent about this simulation is that it allows the user to view the same simulation at four different levels of difficulty. For instance, see it as a simple replication fork, a replication fork with proteins and enzymes, concentrated replication and the trombone model. By doing this, students will be more engaged as they do not have to move onto a more complex level of understanding until they feel they are ready.

Instructions
Click the link above to be directed to the basic animation. Get students to work through the animation at their own pace, ensuring they understand all the information being presented to them.

When the students feel that they understand the content sufficiently, ask them to create a flowchart of the steps involved in DNA replication, with their own diagrams based on what they saw in the simulation.


Outcomes Covered
9.3.4.2.1 describe the process of DNA replication and explain its significance
9.3.4.2.1 explain the relationship between proteins and polypeptides
9.3.4.3.3 process information to construct a flow chart that shows that changes in DNA sequences can result in changes in cell activity
7.1 H6 explains why the biochemical processes that occur in cells are related to macroscopic changes in the organism

EChalk

Link to peppered moth simulation

Introduction
eChalk is a website with lots of interactive games and simulations based around a variety of topics, from humanities to maths and science. Although you need a paid subscription to unlock the majority of the site, there are many simulations that can be accessed in the free version. As with many simulations, this has great potential for engaging students through its use of games and activities which allows students to see the scientific principle being demonstrated, but also have fun and feel as though they're playing a game at the same time.

Instructions
The simulation I chose is a visual representation of the peppered moth story. This is an example commonly used in biology as it's a great example of how natural selection works through selective pressures and also how humans have changed the environment and the impact this has on various organisms.

To play this game, click the link above.

The user plays as a bird eating the peppered moth and clicks on a moth to eat it. The user can also select if they want to simulate the conditions prior to the industrial revolution and after the industrial evolution and compare how easy or difficult it is to eat the moths depending on the colour of the trees. 


This is an excellent way to start a class discussion about the processes of natural selection and how it relates to human activity. 

Outcomes
Stage 6
9.3.1.2.1 outline the impact on the evolution of plants and animals of: changes in physical/chemical conditions in the environment and competition for resources
9.3.1.3.2 analyse information from secondary sources to prepare a case study to show how an environmental change can lead to changes in a species
7.1 H2 analyses the ways in which models, theories and laws in biology have been tested and validated
7.1 H7 analyses the impact of natural and human processes on biodiversity
7.1 H8 evaluates the impact of human activity on the interactions of organisms and their environment
7.1 H10 describes the mechanisms of evolution and assesses the impact of human activity on evolution

Science by Doing

Link to homepage

Introduction
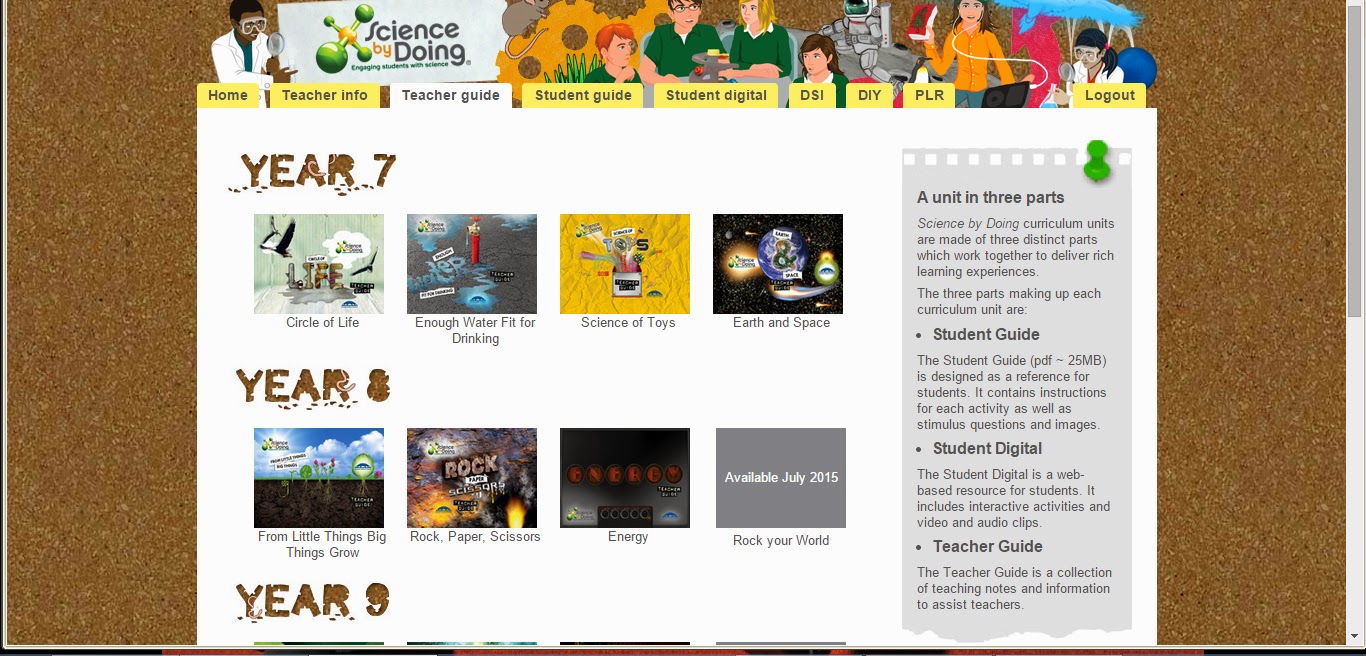
Science by doing is a content based website which has the science syllabus split up into contexts. These contexts are complete with detailed activities for teachers and students alike. Although this website requires creating an account and having this account approved, it is completely free for anyone, regardless of if they have a university or school email. This website is engaging as it teaches students content through a combination of videos, interactive animations and quizzes. This should hopefully keep students engaged by having a variety of activities to learn content, as opposed to just being taught through direct instruction in the classroom.

Instructions
When undertaking a unit, students could spend roughly 50% of a class going through the activities in their topic, and spend the remainder doing pracs or having class discussions about the content they've learnt. Here the example I use is the stage 5 (year 9) topic "Light, Sound Action".


First, the teacher should download the teacher packs for the topic which can be found by clicking the teacher tab on the homepage, then scrolling down to "Light, Sound, Action" under the year 9 topics heading. The teacher can then use the activities pack as a guide for class practicals and experiments throughout the unit.


Students access the content through the "student" tab at the top of the screen, and can then download the student guide. The student guide works as a kind of an interactive textbook they can work through in class to learn all the content they need to for a unit.

They can then click on the "student digital" tab at the top of the screen and work through the videos, activities and animations under each section.


Outcomes Covered
Stage 5

SC5-7WS processes, analyses and evaluates data from first-hand investigations and secondary sources to develop evidence-based arguments and conclusions

SC5-11PW explains how scientific understanding about energy conservation, transfers and transformations is applied in systems

SC5-10PW applies models, theories and laws to explain situations involving energy, force and motion
PW1 Energy transfer through different mediums can be explained using wave and particle models. (ACSSU182)
Students:
a. explain, in terms of the particle model, the processes underlying convection and conduction of heat energy
b. identify situations where waves transfer energy
c. describe qualitatively, using the wave model, the features of waves including wavelength, frequency and speed
d. explain, using the particle model, the transmission of sound in different mediums
e. relate the properties of different types of radiation in the electromagnetic spectrum to their uses in everyday life, including communications technology
f. describe the occurrence and some applications of absorption, reflection and refraction in everyday situations


Tickertape Graphing Excersise

Introduction
This exercise is designed to teach students both working scientifically and spreadsheet/graphing skills, but also forces. By doing this, students will get to see first hand how forces and motion can be calculated through excel (or google sheets or the school's preferred web apps). Students will be walked through step-by-step how to do the first graph and then will be expected to create the second graph themselves, giving them a chance to both learn the knowledge and have a way of showcasing their new skills

Instructions
The following is an example of the prac worksheet:
Aim: To investigate the motion of a trolley rolling down a ramp. Data for the motion

will be collected using a ticker timer, and graphs of displacement against time and

velocity against time will be plotted.

Equipment:

Ticker timer

Ticker tape

Power pack (set to 10 V AC)

Connecting wires

Dynamics trolley

Ramp

Adhesive tape

Method: Connect the ticker timer to the power pack using the connecting wires.

Check that the ticker timer vibrates when switched on. Thread a piece of ticker tape

about 2 m long through the timer, ensuring that it passes underneath the carbon

paper.

Attach a trolley to the end of the ticker tape using adhesive tape. Place the timer at

the top of the ramp, and release the trolley so that the tape can pass freely through

the ticker timer as it rolls. Start the timer, and allow the trolley to roll down the

ramp. Stop the timer.

The time between each of the dots is 1/50 of a second (0.02 seconds).

start


Draw a line through the first clear dot, then every fifth dot after that. There should

be five spaces per section. This represents a time of 5 x 0.02 = 0.1 seconds.

Measure the distance travelled by the rolling trolley from the start to each line . Fill

your values for time and distance into a table like the one shown over the page.

Construct a table of your results in a new spreadsheet


Get Excel to save you some time by automatically calculating the speed for you.

Double check your values with a calculator to compare to excel's calculations.

Using Excel, plot graphs of displacement from start against time and velocity against

time. Use X-Y scatter charts. Make your graphs large, and reduce the font on the

axes to a small size.


Questions relating to analysing the data and effectiveness of the experiment will follow with a full prac write up.


Syllabus Dotpoints
SC5-10PW applies models, theories and laws to explain situations involving energy, force and motion

PW2 The motion of objects can be described and predicted using the laws of physics. (ACSSU229)
b. explain qualitatively the relationship between distance, speed and time
c. relate acceleration qualitatively to a change in speed and/or direction as a result of a net force
d. analyse qualitatively everyday situations involving motion in terms of Newton's laws

WS5.1 Students identify data to be collected for an investigation by:
b. explaining why certain types of information need to be collected in a range of investigation types
c. selecting possible sources of data, including secondary sources, relevant to the investigation
d. justifying why variables need to be kept constant if reliable first-hand data is to be collected in controlled experiments

SC5-6WS undertakes first-hand investigations to collect valid and reliable data and information, individually and collaboratively

WS6 Students conduct investigations by:
b. safely constructing, assembling and manipulating identified equipment
d. using appropriate units for measuring physical quantities
e. reporting data and information, evidence and findings, with accuracy and honesty
f. evaluating the effectiveness of the planned procedure, considering risk factors and ethical issues, and suggesting improvements as appropriate
SC5-7WS processes, analyses and evaluates data from first-hand investigations and secondary sources to develop evidence-based arguments and conclusions

WS7.1 Students process data and information by:
a. selecting and using a variety of methods to organise data and information including diagrams, tables, models, spreadsheets and databases
d. applying numerical procedures and mathematical concepts and using digital technologies, where appropriate
f. describing specific ways to improve the quality of the data

WS7.2 Students analyse data and information by:
a. analysing patterns and trends, including identifying inconsistencies in data and information (ACSIS169, ACSIS203)
b. describing relationships between variables
c. assessing the validity and reliability of first-hand data

Major Differences: Open and Closed Circulatory Systems

Link to page


Introduction

Major differences is a content-based website which compares various biological phenomena, Although the website has many comparisons which seem to extend beyond the HSC curriculum, the website is engaging as it compares concepts in simple terms that are easy to understand, therefore will help them with revision.


Instructions

Students should browse the site and create their own diagrams of the two circulatory systems. This way, students can see the information presented in both formats, and use their preferred format for revision.


Below is a screengrab of the website


Syllabus Dotpoints
Stage 6
8.3.4.2.5compare open and closed circulatory systems using one vertebrate and one invertebrate as examples

Iko Human Body Systems

Link here

Introduction
Iko.net's virtual human body allows people to look at the different systems in the body without having to perform a dissection on a model organism.

Instructions
Click on the link above and select the body system you wish to look at. For a class activity, get students to investigate a part of the human body and sketch it, as they would in a regular dissection. Look at certain transport systems and compare the role of each system. Below are examples of the respiratory, circulatory and excretory system.


Syllabus Dotpoints
Stage 6
8.3.4.2.1  compare the roles of respiratory, circulatory and excretory systems
8.3.4.2.3  explain the relationship between the requirements of cells and the need for transport systems in multicellular organisms

Larrakia

Homepage here

Introduction
Larrakia is a website powered through CSIRO which has information relating to the Indigenous Australian's calendar of the seasons. Individuals can gather information about the current seasonal changes and the behaviours and actions of different native plants and animals at this time.

Instructions
This website is perfect for science life skills students as it perfectly covers one of their dotpoints (see below) and is also simple and clean to use with lots of interactive features.

For use in class, ask each student to collect data from a season of their choosing (a current season, the season their birthday falls in etc.). Ask them to copy down information about the plants and animals in their chosen season and present to the class as a short, one minute, informal presentation.


Syllabus Dot Points
Science Life skills: explore a seasonal calendar used by Aboriginal and Torres Strait Islander peoples
Students communicate by: presenting ideas and information gathered through a scientific investigation in a variety of forms, using digital technologies as appropriate
compare the timing of the seasons in the Southern and Northern hemispheres
presenting ideas and information gathered through a scientific investigation in a variety of
forms, using digital technologies as appropriate
SCLS-14ES explores features of the solar system, including the Earth’s position and movement
SCLS-9WS uses a variety of strategies to communicate information about an investigation