Friday, 24 April 2015
Google Sheets
Link to sample google sheet
Introduction
Google sheets is google's alternative to excel. It works particularly well for group assignments activities, as multiple can edit the sheet at one time. This will engage students as there is less need to for the traditional need to go and enter things on the teacher's computer or on the class whiteboard.
Instructions
Google spreadsheets can be easily acsessed and used if the user has a google account. The creator of the sheet simply needs to upload a link to the class online learning system (such as edmodo) and students can enter their own data. The blank google sheet looks like this:

The following activity is called "Genetic Roulette" and it starts students thinking about genes and heredity in stage 5. By entering their own traits and comparing that to the rest of their class, they are engaged in the task and will hopefully be able to relay this activity to the information they learn later on in the topic.
First, ask students to answer questions about traits they have. I have listed some example question below:
1. Can you roll your tongue?
2. When you fold your hands, does your right thumb or left thumb end up on top?
3. Do you have a cleft in your chin ?
4. Do you have free or attached earlobes ?
5. Is your second toe longer than your first ?
6. Do you have mid-digital hair on your fingers ?
7. Do you have a widow's peak?
8. Do you have thin, flat nails or curved nails?
9. What is your height measured in centimetres?
10. What is the length of your little finger on your right hand in millimetres?
Introduction
Google sheets is google's alternative to excel. It works particularly well for group assignments activities, as multiple can edit the sheet at one time. This will engage students as there is less need to for the traditional need to go and enter things on the teacher's computer or on the class whiteboard.
Instructions
Google spreadsheets can be easily acsessed and used if the user has a google account. The creator of the sheet simply needs to upload a link to the class online learning system (such as edmodo) and students can enter their own data. The blank google sheet looks like this:
The following activity is called "Genetic Roulette" and it starts students thinking about genes and heredity in stage 5. By entering their own traits and comparing that to the rest of their class, they are engaged in the task and will hopefully be able to relay this activity to the information they learn later on in the topic.
First, ask students to answer questions about traits they have. I have listed some example question below:
1. Can you roll your tongue?
2. When you fold your hands, does your right thumb or left thumb end up on top?
3. Do you have a cleft in your chin ?
4. Do you have free or attached earlobes ?
5. Is your second toe longer than your first ?
6. Do you have mid-digital hair on your fingers ?
7. Do you have a widow's peak?
8. Do you have thin, flat nails or curved nails?
9. What is your height measured in centimetres?
10. What is the length of your little finger on your right hand in millimetres?
Then, get student to enter their information on the class google spreadsheet (link above), a screenshot of which is shown below:

Lastly, compare class results and get the students analysing the traits with question such as the following:
Lastly, compare class results and get the students analysing the traits with question such as the following:
1. Identify which traits are continuous and discrete
2. Explain which traits are likely due to one gene or many genes working together
3. List five types of variation you see in humans
4. After examining the class data, draw a histogram to represent the range of heights in your class. Determine appropriate class intervals before constructing your graph.
Outcomes Covered
LW3 b. identify that during reproduction the transmission of heritable characteristics from one
generation to the next involves DNA and genes (ACSSU184)
c. identify that genetic information is transferred as genes in the DNA of chromosomes
WS5.1 Students identify data to be collected for an investigation by:
b. explaining why certain types of information need to be collected in a range of investigation types
c. selecting possible sources of data, including secondary sources, relevant to the investigation
d. justifying why variables need to be kept constant if reliable first-hand data is to be collected in controlled experiments
SC5-6WS undertakes first-hand investigations to collect valid and reliable data and information, individually and collaboratively
WS6 Students conduct investigations by:
b. safely constructing, assembling and manipulating identified equipment
d. using appropriate units for measuring physical quantities
e. reporting data and information, evidence and findings, with accuracy and honesty
f. evaluating the effectiveness of the planned procedure, considering risk factors and ethical issues, and suggesting improvements as appropriate
SC5-7WS processes, analyses and evaluates data from first-hand investigations and secondary sources to develop evidence-based arguments and conclusions
WS7.1 Students process data and information by:
a. selecting and using a variety of methods to organise data and information including diagrams, tables, models, spreadsheets and databases
d. applying numerical procedures and mathematical concepts and using digital technologies, where appropriate
f. describing specific ways to improve the quality of the data
WS7.2 Students analyse data and information by:
a. analysing patterns and trends, including identifying inconsistencies in data and information (ACSIS169, ACSIS203)
b. describing relationships between variables
c. assessing the validity and reliability of first-hand data
Createrly
Link to homepage
Introduction
Createrly is an app which allows the user to create mindmaps, flowcharts and other diagrams with which to present information. It is free to sign up with and allows users to use a preexisting template for their ideas or create a new one. This shows great potential for student engagement as it's a good alternative to the traditional mind map on a whiteboard or piece of paper idea. This means that the mind map can be saved (which it couldn't be on a whiteboard) and sent around the class (which it couldn't on a piece of paper), enabling students to go back and look at it again.
Instructions
Createrly is very easy to use, and doesn't require registration if you don't wish to save your work. Simply click on the link above and then on the "try createrly now" button on the homepage. Next, a user can select a template they wish to use or if they wish to begin with a blank page. Here, I clicked on the Mind Map templates section and selected my preferred design.


As a class activity, createrly would be a great tool to use at the start of a unit as part of a class discussion. Students could offer things they already know about a topic. This could be really useful with a topic such as genetics in stage 5. Students may have heard about genetic diseases or heritable traits and use these as a basis for a discussion to start the unit off.
Outcomes Covered
Stage 5
SC5-15LW explains how biological understanding has advanced through scientific discoveries, technological developments and the needs of society
LW3 b. identify that during reproduction the transmission of heritable characteristics from one generation to the next involves DNA and genes (ACSSU184)
c. identify that genetic information is transferred as genes in the DNA of chromosomes
Introduction
Createrly is an app which allows the user to create mindmaps, flowcharts and other diagrams with which to present information. It is free to sign up with and allows users to use a preexisting template for their ideas or create a new one. This shows great potential for student engagement as it's a good alternative to the traditional mind map on a whiteboard or piece of paper idea. This means that the mind map can be saved (which it couldn't be on a whiteboard) and sent around the class (which it couldn't on a piece of paper), enabling students to go back and look at it again.
Instructions
Createrly is very easy to use, and doesn't require registration if you don't wish to save your work. Simply click on the link above and then on the "try createrly now" button on the homepage. Next, a user can select a template they wish to use or if they wish to begin with a blank page. Here, I clicked on the Mind Map templates section and selected my preferred design.
As a class activity, createrly would be a great tool to use at the start of a unit as part of a class discussion. Students could offer things they already know about a topic. This could be really useful with a topic such as genetics in stage 5. Students may have heard about genetic diseases or heritable traits and use these as a basis for a discussion to start the unit off.
Outcomes Covered
Stage 5
SC5-15LW explains how biological understanding has advanced through scientific discoveries, technological developments and the needs of society
LW3 b. identify that during reproduction the transmission of heritable characteristics from one generation to the next involves DNA and genes (ACSSU184)
c. identify that genetic information is transferred as genes in the DNA of chromosomes
LW4 c. explain, using examples, how natural selection relates to changes in a population, eg in the development of resistance of bacteria to antibiotics and insects to pesticides
LW4 d. outline the roles of genes and environmental factors in the survival of organisms in a population
LW4 d. outline the roles of genes and environmental factors in the survival of organisms in a population
Prezi
Link to Homepage
Introduction
Prezi is an app which allows the user to create interactive presentations centered around a particular topic. This is an engaging tool for students as it allows them to be creative in their presentation and the bright colours and zooming should engage their classmates in their presentation.
Instructions
To use prezi you need to register a free account (paid accounts can be used, but are not necessary). Once loaded, click the "new prezi" button, select a template and get started!


A great use for a prezi in class would be as a tool to create a presentation on a topic like climate change, covering the science behind it and the ecological and societal impacts of it. The screencaps below are an example of a prezi on climate change:


Outcomes Covered
Stage 5
SC5-11PW explains how scientific understanding about energy conservation, transfers and
Introduction
Prezi is an app which allows the user to create interactive presentations centered around a particular topic. This is an engaging tool for students as it allows them to be creative in their presentation and the bright colours and zooming should engage their classmates in their presentation.
Instructions
To use prezi you need to register a free account (paid accounts can be used, but are not necessary). Once loaded, click the "new prezi" button, select a template and get started!
A great use for a prezi in class would be as a tool to create a presentation on a topic like climate change, covering the science behind it and the ecological and societal impacts of it. The screencaps below are an example of a prezi on climate change:
Outcomes Covered
Stage 5
SC5-11PW explains how scientific understanding about energy conservation, transfers and
transformations is applied in systems SC5-11PW
SC5-13ES explains how scientific knowledge about global patterns of geological activity and
interactions involving global systems can be used to inform decisions related to
contemporary issues
SC5-14LW explains how biological understanding has advanced through scientific discoveries,
technological developments and the needs of society
interactions involving global systems can be used to inform decisions related to
contemporary issues
SC5-14LW explains how biological understanding has advanced through scientific discoveries,
technological developments and the needs of society
ES3: People use scientific knowledge to evaluate claims, explanations or predictions in relation to interactions involving the atmosphere, biosphere, hydrosphere and lithosphere.
c. evaluate scientific evidence of some current issues affecting society that are the result of human activity on global systems, eg the greenhouse effect, ozone layer depletion, effect of climate change on sea levels, long-term effects of waste management and loss of biodiversity
d. discuss the reasons different groups in society may use or weight criteria differently to evaluate claims, explanations or predictions in making decisions about contemporary issues involving interactions of the Earth's spheres
PW4 Energy conservation in a system can be explained by describing energy transfers and transformations.
c. discuss, using examples, how the values and needs of contemporary society can influence the focus of scientific research in the area of increasing efficiency of the use of electricity by individuals and society
d. discuss viewpoints and choices that need to be considered in making decisions about the use of non-renewable energy resources
PW1 f. describe the occurrence and some applications of absorption, reflection and refraction in everyday situations
LW2 Conserving and maintaining the quality and sustainability of the environment requires scientific understanding of interactions within, the cycling of matter and the flow of energy through ecosystems.
d. analyse how changes in some biotic and abiotic components of an ecosystem affect populations and/or communities
e. assess ways that Aboriginal and Torres Strait Islander peoples' cultural practices and knowledge of the environment contribute to the conservation and management of sustainable ecosystems
f. evaluate some examples in ecosystems, of strategies used to balance conserving,
protecting and maintaining the quality and sustainability of the environment with human
activities and needs
SC5-9WS presents science ideas and evidence for a particular purpose and to a specific audience,
using appropriate scientific language, conventions and representations
WS9 Students communicate by:
a. selecting and using in presentations, for different purposes and contexts, appropriate text
types including discussions, explanations, expositions, procedures, recounts or reports
e. presenting scientific ideas and information for a particular purpose, including constructing
evidence-based arguments and using appropriate scientific language, conventions and
representations for specific audiences
c. evaluate scientific evidence of some current issues affecting society that are the result of human activity on global systems, eg the greenhouse effect, ozone layer depletion, effect of climate change on sea levels, long-term effects of waste management and loss of biodiversity
d. discuss the reasons different groups in society may use or weight criteria differently to evaluate claims, explanations or predictions in making decisions about contemporary issues involving interactions of the Earth's spheres
PW4 Energy conservation in a system can be explained by describing energy transfers and transformations.
c. discuss, using examples, how the values and needs of contemporary society can influence the focus of scientific research in the area of increasing efficiency of the use of electricity by individuals and society
d. discuss viewpoints and choices that need to be considered in making decisions about the use of non-renewable energy resources
PW1 f. describe the occurrence and some applications of absorption, reflection and refraction in everyday situations
LW2 Conserving and maintaining the quality and sustainability of the environment requires scientific understanding of interactions within, the cycling of matter and the flow of energy through ecosystems.
d. analyse how changes in some biotic and abiotic components of an ecosystem affect populations and/or communities
e. assess ways that Aboriginal and Torres Strait Islander peoples' cultural practices and knowledge of the environment contribute to the conservation and management of sustainable ecosystems
f. evaluate some examples in ecosystems, of strategies used to balance conserving,
protecting and maintaining the quality and sustainability of the environment with human
activities and needs
using appropriate scientific language, conventions and representations
WS9 Students communicate by:
a. selecting and using in presentations, for different purposes and contexts, appropriate text
types including discussions, explanations, expositions, procedures, recounts or reports
e. presenting scientific ideas and information for a particular purpose, including constructing
evidence-based arguments and using appropriate scientific language, conventions and
representations for specific audiences
Edmodo
Link to homepage
Introduction
Edmodo is a social networking app (much like facebook) which allows the user to create an online learning system for a particular class. One of the best features about edmodo is it allows for quizzes, polls and assignments to all be uploaded to the one website, rather than using separate apps for each. The interface is also very similar to a facebook group which would be an excellent tool for student engagement, as this is something students can relate to and know how to use without too much instruction. Edmodo offers itself best to a single topic, due to it's scrolling nature, and would therefore be best used at either a stage 6 tool, or for a single topic in stage 4 or 5
Instructions
Teachers create an edmodo page and then invite students to participate in it. One of the best features of the site is allowing students to upload assignments. This saves paper and teachers having an influx of emails with student assignments.Below is a screengrab of the create assignment page.

I propose that the graphing assignment in this post be uploaded to the class edmodo.
Outcomes Covered
Using the graphing exercise, the course outcomes would be:
SC5-10PW applies models, theories and laws to explain situations involving energy, force and motion
Instructions
Teachers create an edmodo page and then invite students to participate in it. One of the best features of the site is allowing students to upload assignments. This saves paper and teachers having an influx of emails with student assignments.Below is a screengrab of the create assignment page.
I propose that the graphing assignment in this post be uploaded to the class edmodo.
Outcomes Covered
Using the graphing exercise, the course outcomes would be:
SC5-10PW applies models, theories and laws to explain situations involving energy, force and motion
PW2 The motion of objects can be described and predicted using the laws of physics. (ACSSU229)
b. explain qualitatively the relationship between distance, speed and time
c. relate acceleration qualitatively to a change in speed and/or direction as a result of a net force
d. analyse qualitatively everyday situations involving motion in terms of Newton's laws
WS5.1 Students identify data to be collected for an investigation by:
b. explaining why certain types of information need to be collected in a range of investigation types
c. selecting possible sources of data, including secondary sources, relevant to the investigation
d. justifying why variables need to be kept constant if reliable first-hand data is to be collected in controlled experiments
SC5-6WS undertakes first-hand investigations to collect valid and reliable data and information, individually and collaboratively
WS6 Students conduct investigations by:
b. safely constructing, assembling and manipulating identified equipment
d. using appropriate units for measuring physical quantities
e. reporting data and information, evidence and findings, with accuracy and honesty
f. evaluating the effectiveness of the planned procedure, considering risk factors and ethical issues, and suggesting improvements as appropriate
SC5-7WS processes, analyses and evaluates data from first-hand investigations and secondary sources to develop evidence-based arguments and conclusions
WS7.1 Students process data and information by:
a. selecting and using a variety of methods to organise data and information including diagrams, tables, models, spreadsheets and databases
d. applying numerical procedures and mathematical concepts and using digital technologies, where appropriate
f. describing specific ways to improve the quality of the data
WS7.2 Students analyse data and information by:
a. analysing patterns and trends, including identifying inconsistencies in data and information (ACSIS169, ACSIS203)
b. describing relationships between variables
c. assessing the validity and reliability of first-hand data
WS7.1 Students process data and information by:
a. selecting and using a variety of methods to organise data and information including diagrams, tables, models, spreadsheets and databases
d. applying numerical procedures and mathematical concepts and using digital technologies, where appropriate
f. describing specific ways to improve the quality of the data
WS7.2 Students analyse data and information by:
a. analysing patterns and trends, including identifying inconsistencies in data and information (ACSIS169, ACSIS203)
b. describing relationships between variables
c. assessing the validity and reliability of first-hand data
TedEd
Link to homepage and carbon cycle video link
Introduction
TedEd is a content based website with a large number of free videos covering a variety of topics. Although many of the science topics discussed are more of an extension of the content required in high school, there are a number of interesting videos which cover syllabus points. What's really cool about TedEd is the quizzes you can do after watching a video ("think") or the links to further information based on the video's content ("dig deeper"). This is great for student engagement as it allows the students to link what they're watching to potential questions in a test, and will hopefully motivate them to ask further questions and dig deeper.

Instructions
TedEd would be a great resource to use for revision or homework questions. Teachers could set a task where they ask students to watch the video and answer questions. This also offers an opportunity for differentiated instruction, as student looking for a deeper understanding can read the "dig deeper" page and gather more information. Below are screen shots of the three different activities related to the video.


Outcomes Covered
SC5-13ES explains how scientific knowledge about global patterns of geological activity and interactions involving global systems can be used to inform decisions related to contemporary issues
ES3 a. outline how global systems rely on interactions involving the biosphere, lihosphere, hydrosphere and atmosphere, including the carbon cycle (ACSSU189)
Introduction
TedEd is a content based website with a large number of free videos covering a variety of topics. Although many of the science topics discussed are more of an extension of the content required in high school, there are a number of interesting videos which cover syllabus points. What's really cool about TedEd is the quizzes you can do after watching a video ("think") or the links to further information based on the video's content ("dig deeper"). This is great for student engagement as it allows the students to link what they're watching to potential questions in a test, and will hopefully motivate them to ask further questions and dig deeper.
Instructions
TedEd would be a great resource to use for revision or homework questions. Teachers could set a task where they ask students to watch the video and answer questions. This also offers an opportunity for differentiated instruction, as student looking for a deeper understanding can read the "dig deeper" page and gather more information. Below are screen shots of the three different activities related to the video.
Outcomes Covered
SC5-13ES explains how scientific knowledge about global patterns of geological activity and interactions involving global systems can be used to inform decisions related to contemporary issues
ES3 a. outline how global systems rely on interactions involving the biosphere, lihosphere, hydrosphere and atmosphere, including the carbon cycle (ACSSU189)
Harvard DNA Replication
Link to simulation
Introduction
Harvard's DNA replication simulation is an interactive animation which allows the user to look at how DNA replication works in a variety of ways. They are also able to stop and start the simulation and move back and forth as they need to. What is really excellent about this simulation is that it allows the user to view the same simulation at four different levels of difficulty. For instance, see it as a simple replication fork, a replication fork with proteins and enzymes, concentrated replication and the trombone model. By doing this, students will be more engaged as they do not have to move onto a more complex level of understanding until they feel they are ready.
Instructions
Click the link above to be directed to the basic animation. Get students to work through the animation at their own pace, ensuring they understand all the information being presented to them.
When the students feel that they understand the content sufficiently, ask them to create a flowchart of the steps involved in DNA replication, with their own diagrams based on what they saw in the simulation.


Outcomes Covered
9.3.4.2.1 describe the process of DNA replication and explain its significance
9.3.4.2.1 explain the relationship between proteins and polypeptides
9.3.4.3.3 process information to construct a flow chart that shows that changes in DNA sequences can result in changes in cell activity
7.1 H6 explains why the biochemical processes that occur in cells are related to macroscopic changes in the organism
Introduction
Harvard's DNA replication simulation is an interactive animation which allows the user to look at how DNA replication works in a variety of ways. They are also able to stop and start the simulation and move back and forth as they need to. What is really excellent about this simulation is that it allows the user to view the same simulation at four different levels of difficulty. For instance, see it as a simple replication fork, a replication fork with proteins and enzymes, concentrated replication and the trombone model. By doing this, students will be more engaged as they do not have to move onto a more complex level of understanding until they feel they are ready.
Instructions
Click the link above to be directed to the basic animation. Get students to work through the animation at their own pace, ensuring they understand all the information being presented to them.
When the students feel that they understand the content sufficiently, ask them to create a flowchart of the steps involved in DNA replication, with their own diagrams based on what they saw in the simulation.
Outcomes Covered
9.3.4.2.1 describe the process of DNA replication and explain its significance
9.3.4.2.1 explain the relationship between proteins and polypeptides
9.3.4.3.3 process information to construct a flow chart that shows that changes in DNA sequences can result in changes in cell activity
7.1 H6 explains why the biochemical processes that occur in cells are related to macroscopic changes in the organism
EChalk
Link to peppered moth simulation
Introduction
eChalk is a website with lots of interactive games and simulations based around a variety of topics, from humanities to maths and science. Although you need a paid subscription to unlock the majority of the site, there are many simulations that can be accessed in the free version. As with many simulations, this has great potential for engaging students through its use of games and activities which allows students to see the scientific principle being demonstrated, but also have fun and feel as though they're playing a game at the same time.
Instructions
The simulation I chose is a visual representation of the peppered moth story. This is an example commonly used in biology as it's a great example of how natural selection works through selective pressures and also how humans have changed the environment and the impact this has on various organisms.
To play this game, click the link above.


Outcomes
Introduction
eChalk is a website with lots of interactive games and simulations based around a variety of topics, from humanities to maths and science. Although you need a paid subscription to unlock the majority of the site, there are many simulations that can be accessed in the free version. As with many simulations, this has great potential for engaging students through its use of games and activities which allows students to see the scientific principle being demonstrated, but also have fun and feel as though they're playing a game at the same time.
Instructions
The simulation I chose is a visual representation of the peppered moth story. This is an example commonly used in biology as it's a great example of how natural selection works through selective pressures and also how humans have changed the environment and the impact this has on various organisms.
To play this game, click the link above.
The user plays as a bird eating the peppered moth and clicks on a moth to eat it. The user can also select if they want to simulate the conditions prior to the industrial revolution and after the industrial evolution and compare how easy or difficult it is to eat the moths depending on the colour of the trees.
This is an excellent way to start a class discussion about the processes of natural selection and how it relates to human activity.
Outcomes
Stage 6
9.3.1.2.1 outline the impact on the evolution of plants and animals of: changes in physical/chemical conditions in the environment and competition for resources
9.3.1.3.2 analyse information from secondary sources to prepare a case study to show how an environmental change can lead to changes in a species
7.1 H2 analyses the ways in which models, theories and laws in biology have been tested and validated
7.1 H7 analyses the impact of natural and human processes on biodiversity
7.1 H8 evaluates the impact of human activity on the interactions of organisms and their environment
7.1 H10 describes the mechanisms of evolution and assesses the impact of human activity on evolution
Science by Doing
Link to homepage
Introduction
Science by doing is a content based website which has the science syllabus split up into contexts. These contexts are complete with detailed activities for teachers and students alike. Although this website requires creating an account and having this account approved, it is completely free for anyone, regardless of if they have a university or school email. This website is engaging as it teaches students content through a combination of videos, interactive animations and quizzes. This should hopefully keep students engaged by having a variety of activities to learn content, as opposed to just being taught through direct instruction in the classroom.
Instructions
When undertaking a unit, students could spend roughly 50% of a class going through the activities in their topic, and spend the remainder doing pracs or having class discussions about the content they've learnt. Here the example I use is the stage 5 (year 9) topic "Light, Sound Action".
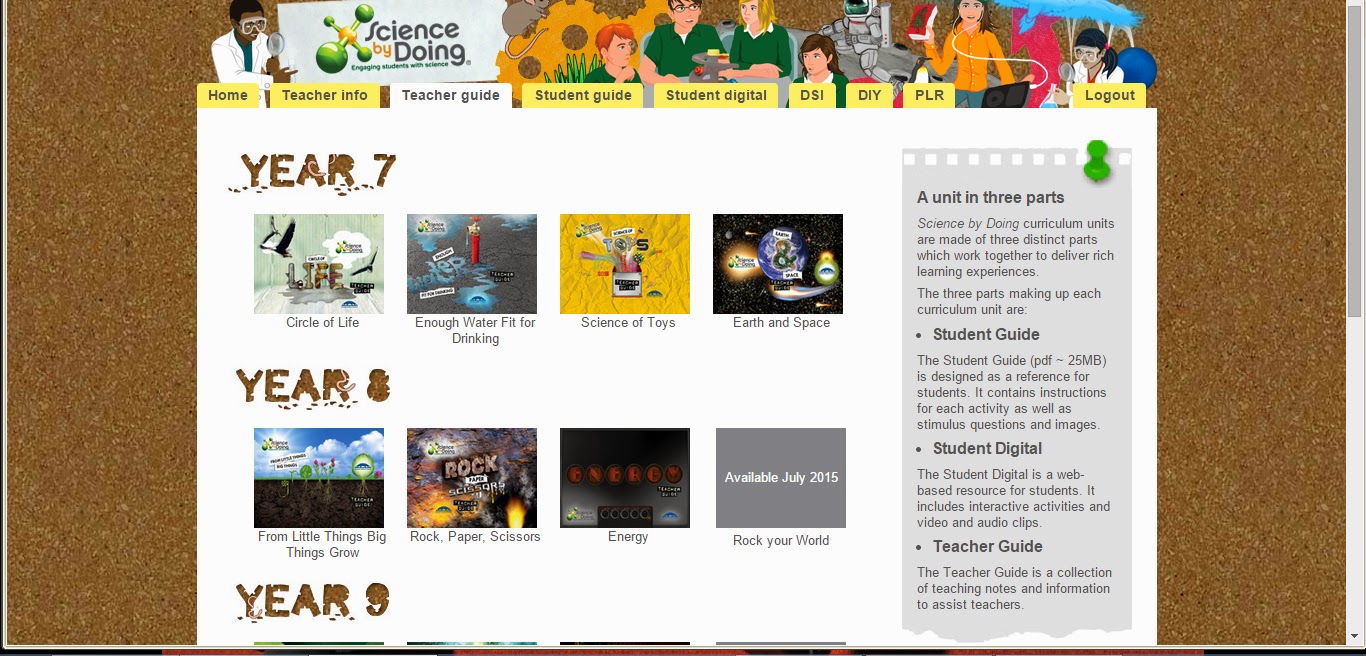
First, the teacher should download the teacher packs for the topic which can be found by clicking the teacher tab on the homepage, then scrolling down to "Light, Sound, Action" under the year 9 topics heading. The teacher can then use the activities pack as a guide for class practicals and experiments throughout the unit.


Students access the content through the "student" tab at the top of the screen, and can then download the student guide. The student guide works as a kind of an interactive textbook they can work through in class to learn all the content they need to for a unit.
They can then click on the "student digital" tab at the top of the screen and work through the videos, activities and animations under each section.


Outcomes Covered
Stage 5
SC5-7WS processes, analyses and evaluates data from first-hand investigations and secondary sources to develop evidence-based arguments and conclusions
SC5-11PW explains how scientific understanding about energy conservation, transfers and transformations is applied in systems
SC5-10PW applies models, theories and laws to explain situations involving energy, force and motion
PW1 Energy transfer through different mediums can be explained using wave and particle models. (ACSSU182)
Students:
a. explain, in terms of the particle model, the processes underlying convection and conduction of heat energy
Introduction
Science by doing is a content based website which has the science syllabus split up into contexts. These contexts are complete with detailed activities for teachers and students alike. Although this website requires creating an account and having this account approved, it is completely free for anyone, regardless of if they have a university or school email. This website is engaging as it teaches students content through a combination of videos, interactive animations and quizzes. This should hopefully keep students engaged by having a variety of activities to learn content, as opposed to just being taught through direct instruction in the classroom.
Instructions
When undertaking a unit, students could spend roughly 50% of a class going through the activities in their topic, and spend the remainder doing pracs or having class discussions about the content they've learnt. Here the example I use is the stage 5 (year 9) topic "Light, Sound Action".
First, the teacher should download the teacher packs for the topic which can be found by clicking the teacher tab on the homepage, then scrolling down to "Light, Sound, Action" under the year 9 topics heading. The teacher can then use the activities pack as a guide for class practicals and experiments throughout the unit.
Students access the content through the "student" tab at the top of the screen, and can then download the student guide. The student guide works as a kind of an interactive textbook they can work through in class to learn all the content they need to for a unit.
They can then click on the "student digital" tab at the top of the screen and work through the videos, activities and animations under each section.
Outcomes Covered
Stage 5
SC5-7WS processes, analyses and evaluates data from first-hand investigations and secondary sources to develop evidence-based arguments and conclusions
SC5-11PW explains how scientific understanding about energy conservation, transfers and transformations is applied in systems
SC5-10PW applies models, theories and laws to explain situations involving energy, force and motion
PW1 Energy transfer through different mediums can be explained using wave and particle models. (ACSSU182)
Students:
a. explain, in terms of the particle model, the processes underlying convection and conduction of heat energy
b. identify situations where waves transfer energy
c. describe qualitatively, using the wave model, the features of waves including wavelength, frequency and speed
c. describe qualitatively, using the wave model, the features of waves including wavelength, frequency and speed
d. explain, using the particle model, the transmission of sound in different mediums
e. relate the properties of different types of radiation in the electromagnetic spectrum to their uses in everyday life, including communications technology
f. describe the occurrence and some applications of absorption, reflection and refraction in everyday situations
e. relate the properties of different types of radiation in the electromagnetic spectrum to their uses in everyday life, including communications technology
f. describe the occurrence and some applications of absorption, reflection and refraction in everyday situations
Tickertape Graphing Excersise
Introduction
This exercise is designed to teach students both working scientifically and spreadsheet/graphing skills, but also forces. By doing this, students will get to see first hand how forces and motion can be calculated through excel (or google sheets or the school's preferred web apps). Students will be walked through step-by-step how to do the first graph and then will be expected to create the second graph themselves, giving them a chance to both learn the knowledge and have a way of showcasing their new skills
Instructions
The following is an example of the prac worksheet:
Aim: To investigate the motion of a trolley rolling down a ramp. Data for the motion
will be collected using a ticker timer, and graphs of displacement against time and
velocity against time will be plotted.
Equipment:
Ticker timer
Ticker tape
Power pack (set to 10 V AC)
Connecting wires
Dynamics trolley
Ramp
Adhesive tape
Method: Connect the ticker timer to the power pack using the connecting wires.
Check that the ticker timer vibrates when switched on. Thread a piece of ticker tape
about 2 m long through the timer, ensuring that it passes underneath the carbon
paper.
Attach a trolley to the end of the ticker tape using adhesive tape. Place the timer at
the top of the ramp, and release the trolley so that the tape can pass freely through
the ticker timer as it rolls. Start the timer, and allow the trolley to roll down the
ramp. Stop the timer.
The time between each of the dots is 1/50 of a second (0.02 seconds).
start
Draw a line through the first clear dot, then every fifth dot after that. There should
be five spaces per section. This represents a time of 5 x 0.02 = 0.1 seconds.
Measure the distance travelled by the rolling trolley from the start to each line . Fill
your values for time and distance into a table like the one shown over the page.
Construct a table of your results in a new spreadsheet
Get Excel to save you some time by automatically calculating the speed for you.
Double check your values with a calculator to compare to excel's calculations.
Using Excel, plot graphs of displacement from start against time and velocity against
time. Use X-Y scatter charts. Make your graphs large, and reduce the font on the
axes to a small size.
Questions relating to analysing the data and effectiveness of the experiment will follow with a full prac write up.
Syllabus Dotpoints
SC5-10PW applies models, theories and laws to explain situations involving energy, force and motion
PW2 The motion of objects can be described and predicted using the laws of physics. (ACSSU229)
b. explain qualitatively the relationship between distance, speed and time
c. relate acceleration qualitatively to a change in speed and/or direction as a result of a net force
d. analyse qualitatively everyday situations involving motion in terms of Newton's laws
WS5.1 Students identify data to be collected for an investigation by:
b. explaining why certain types of information need to be collected in a range of investigation types
c. selecting possible sources of data, including secondary sources, relevant to the investigation
d. justifying why variables need to be kept constant if reliable first-hand data is to be collected in controlled experiments
SC5-6WS undertakes first-hand investigations to collect valid and reliable data and information, individually and collaboratively
WS6 Students conduct investigations by:
b. safely constructing, assembling and manipulating identified equipment
d. using appropriate units for measuring physical quantities
e. reporting data and information, evidence and findings, with accuracy and honesty
f. evaluating the effectiveness of the planned procedure, considering risk factors and ethical issues, and suggesting improvements as appropriate
b. explain qualitatively the relationship between distance, speed and time
c. relate acceleration qualitatively to a change in speed and/or direction as a result of a net force
d. analyse qualitatively everyday situations involving motion in terms of Newton's laws
WS5.1 Students identify data to be collected for an investigation by:
b. explaining why certain types of information need to be collected in a range of investigation types
c. selecting possible sources of data, including secondary sources, relevant to the investigation
d. justifying why variables need to be kept constant if reliable first-hand data is to be collected in controlled experiments
SC5-6WS undertakes first-hand investigations to collect valid and reliable data and information, individually and collaboratively
WS6 Students conduct investigations by:
b. safely constructing, assembling and manipulating identified equipment
d. using appropriate units for measuring physical quantities
e. reporting data and information, evidence and findings, with accuracy and honesty
f. evaluating the effectiveness of the planned procedure, considering risk factors and ethical issues, and suggesting improvements as appropriate
SC5-7WS processes, analyses and evaluates data from first-hand investigations and secondary sources to develop evidence-based arguments and conclusions
WS7.1 Students process data and information by:
a. selecting and using a variety of methods to organise data and information including diagrams, tables, models, spreadsheets and databases
d. applying numerical procedures and mathematical concepts and using digital technologies, where appropriate
f. describing specific ways to improve the quality of the data
WS7.2 Students analyse data and information by:
a. analysing patterns and trends, including identifying inconsistencies in data and information (ACSIS169, ACSIS203)
b. describing relationships between variables
c. assessing the validity and reliability of first-hand data
WS7.1 Students process data and information by:
a. selecting and using a variety of methods to organise data and information including diagrams, tables, models, spreadsheets and databases
d. applying numerical procedures and mathematical concepts and using digital technologies, where appropriate
f. describing specific ways to improve the quality of the data
WS7.2 Students analyse data and information by:
a. analysing patterns and trends, including identifying inconsistencies in data and information (ACSIS169, ACSIS203)
b. describing relationships between variables
c. assessing the validity and reliability of first-hand data
Major Differences: Open and Closed Circulatory Systems
Link to page
Introduction
Major differences is a content-based website which compares various biological phenomena, Although the website has many comparisons which seem to extend beyond the HSC curriculum, the website is engaging as it compares concepts in simple terms that are easy to understand, therefore will help them with revision.
Instructions
Students should browse the site and create their own diagrams of the two circulatory systems. This way, students can see the information presented in both formats, and use their preferred format for revision.
Below is a screengrab of the website

Syllabus Dotpoints
Stage 6
8.3.4.2.5compare open and closed circulatory systems using one vertebrate and one invertebrate as examples
Introduction
Major differences is a content-based website which compares various biological phenomena, Although the website has many comparisons which seem to extend beyond the HSC curriculum, the website is engaging as it compares concepts in simple terms that are easy to understand, therefore will help them with revision.
Instructions
Students should browse the site and create their own diagrams of the two circulatory systems. This way, students can see the information presented in both formats, and use their preferred format for revision.
Below is a screengrab of the website
Syllabus Dotpoints
Stage 6
8.3.4.2.5compare open and closed circulatory systems using one vertebrate and one invertebrate as examples
Iko Human Body Systems
Link here
Introduction
Iko.net's virtual human body allows people to look at the different systems in the body without having to perform a dissection on a model organism.
Instructions
Click on the link above and select the body system you wish to look at. For a class activity, get students to investigate a part of the human body and sketch it, as they would in a regular dissection. Look at certain transport systems and compare the role of each system. Below are examples of the respiratory, circulatory and excretory system.


Syllabus Dotpoints
Stage 6
8.3.4.2.1 compare the roles of respiratory, circulatory and excretory systems
8.3.4.2.3 explain the relationship between the requirements of cells and the need for transport systems in multicellular organisms
Introduction
Iko.net's virtual human body allows people to look at the different systems in the body without having to perform a dissection on a model organism.
Instructions
Click on the link above and select the body system you wish to look at. For a class activity, get students to investigate a part of the human body and sketch it, as they would in a regular dissection. Look at certain transport systems and compare the role of each system. Below are examples of the respiratory, circulatory and excretory system.
Syllabus Dotpoints
Stage 6
8.3.4.2.1 compare the roles of respiratory, circulatory and excretory systems
8.3.4.2.3 explain the relationship between the requirements of cells and the need for transport systems in multicellular organisms
Larrakia
Homepage here
Introduction
Larrakia is a website powered through CSIRO which has information relating to the Indigenous Australian's calendar of the seasons. Individuals can gather information about the current seasonal changes and the behaviours and actions of different native plants and animals at this time.
Instructions
This website is perfect for science life skills students as it perfectly covers one of their dotpoints (see below) and is also simple and clean to use with lots of interactive features.
For use in class, ask each student to collect data from a season of their choosing (a current season, the season their birthday falls in etc.). Ask them to copy down information about the plants and animals in their chosen season and present to the class as a short, one minute, informal presentation.


Syllabus Dot Points
Science Life skills: explore a seasonal calendar used by Aboriginal and Torres Strait Islander peoples
Students communicate by: presenting ideas and information gathered through a scientific investigation in a variety of forms, using digital technologies as appropriate
compare the timing of the seasons in the Southern and Northern hemispheres
presenting ideas and information gathered through a scientific investigation in a variety of
forms, using digital technologies as appropriate
SCLS-14ES explores features of the solar system, including the Earth’s position and movement
SCLS-9WS uses a variety of strategies to communicate information about an investigation
Introduction
Larrakia is a website powered through CSIRO which has information relating to the Indigenous Australian's calendar of the seasons. Individuals can gather information about the current seasonal changes and the behaviours and actions of different native plants and animals at this time.
Instructions
This website is perfect for science life skills students as it perfectly covers one of their dotpoints (see below) and is also simple and clean to use with lots of interactive features.
For use in class, ask each student to collect data from a season of their choosing (a current season, the season their birthday falls in etc.). Ask them to copy down information about the plants and animals in their chosen season and present to the class as a short, one minute, informal presentation.
Syllabus Dot Points
Science Life skills: explore a seasonal calendar used by Aboriginal and Torres Strait Islander peoples
Students communicate by: presenting ideas and information gathered through a scientific investigation in a variety of forms, using digital technologies as appropriate
compare the timing of the seasons in the Southern and Northern hemispheres
presenting ideas and information gathered through a scientific investigation in a variety of
forms, using digital technologies as appropriate
SCLS-14ES explores features of the solar system, including the Earth’s position and movement
SCLS-9WS uses a variety of strategies to communicate information about an investigation
Scootle
Homepage link
Introduction
Scootle is a free website which allows the user to access a multitude of resources relating to the Australian curriculum, including the science curriculum. Filled with information, simulations and games based on the science curriculum, Scootle is a great tool to use for teachers when lesson planning as it allows for independent learning that is still structured.
Instructions
After creating a free scootle account, click on the "browse resources" tab and select "science".

Scroll down to year 10 science > biology and then the ACSSU185 (The theory of evolution by natural selection explains the diversity of living things and is supported by a range of scientific evidence.

Select the biology food web activity to learn more about an antarctic food web. Students should copy down the food web in detail into their exercise book to document their new knowledge.


Outcomes Covered
SC5-7WS processes, analyses and evaluates data from first-hand investigations and secondary sources to develop evidence-based arguments and conclusions
SC5-14LW analyses interactions between components and processes within biological systems
LW2 Conserving and maintaining the quality and sustainability of the environment requires scientific understanding of interactions within, the cycling of matter and the flow of energy through ecosystems.
c. describe how energy flows through ecosystems, including input and output through food webs (ACSSU176)
f. evaluate some examples in ecosystems, of strategies used to balance conserving,
protecting and maintaining the quality and sustainability of the environment with human activities and needs
Introduction
Scootle is a free website which allows the user to access a multitude of resources relating to the Australian curriculum, including the science curriculum. Filled with information, simulations and games based on the science curriculum, Scootle is a great tool to use for teachers when lesson planning as it allows for independent learning that is still structured.
Instructions
After creating a free scootle account, click on the "browse resources" tab and select "science".
Select the biology food web activity to learn more about an antarctic food web. Students should copy down the food web in detail into their exercise book to document their new knowledge.
Outcomes Covered
SC5-7WS processes, analyses and evaluates data from first-hand investigations and secondary sources to develop evidence-based arguments and conclusions
SC5-14LW analyses interactions between components and processes within biological systems
LW2 Conserving and maintaining the quality and sustainability of the environment requires scientific understanding of interactions within, the cycling of matter and the flow of energy through ecosystems.
c. describe how energy flows through ecosystems, including input and output through food webs (ACSSU176)
f. evaluate some examples in ecosystems, of strategies used to balance conserving,
protecting and maintaining the quality and sustainability of the environment with human activities and needs
Wordle
Homepage Link
Introduction
Wordle is a web app which allows the user to make "word clouds" based on words found in a block of text. This tool is excellent for students to use to find key words in a passage they are reading or to present the key ideas in an assessment task in a creative way.
Instructions
Click the link above to go to the wordle homepage. Click the create tab at the top
 Next enter the text you wish to turn into a word cloud. Alternatively the URL of an RSS feed may be entered. Lastly, click the submit button to view your word cloud.

The word cloud below is based on a passage on climate change. An excellent use for wordle is as a way to start a class discussion or mind map based on the topics that come up relating to climate change. In this example, the words which come up are change, weather, past, climate, processes and conditions.

Syllabus Dotpoints
Stage 5
SC5-13ES explains how scientific knowledge about global patterns of geological activity and interactions involving global systems can be used to inform decisions related to contemporary issues
ES3 People use scientific knowledge to evaluate claims, explanations or predictions in relation to interactions involving the atmosphere, biosphere, hydrosphere and lithosphere.
c. evaluate scientific evidence of some current issues affecting society that are the result of human activity on global systems, eg the greenhouse effect, ozone layer depletion, effect of climate change on sea levels, long-term effects of waste management and loss of biodiversity
d. discuss the reasons different groups in society may use or weight criteria differently to evaluate claims, explanations or predictions in making decisions about contemporary issues involving interactions of the Earth's spheres
Introduction
Wordle is a web app which allows the user to make "word clouds" based on words found in a block of text. This tool is excellent for students to use to find key words in a passage they are reading or to present the key ideas in an assessment task in a creative way.
Instructions
Click the link above to go to the wordle homepage. Click the create tab at the top
Syllabus Dotpoints
Stage 5
SC5-13ES explains how scientific knowledge about global patterns of geological activity and interactions involving global systems can be used to inform decisions related to contemporary issues
ES3 People use scientific knowledge to evaluate claims, explanations or predictions in relation to interactions involving the atmosphere, biosphere, hydrosphere and lithosphere.
c. evaluate scientific evidence of some current issues affecting society that are the result of human activity on global systems, eg the greenhouse effect, ozone layer depletion, effect of climate change on sea levels, long-term effects of waste management and loss of biodiversity
d. discuss the reasons different groups in society may use or weight criteria differently to evaluate claims, explanations or predictions in making decisions about contemporary issues involving interactions of the Earth's spheres
Monday, 20 April 2015
Exploratree
Homepage
Introduction
Exploratree is a web app which allows the user to create "thinking guides", diagrams or mindmaps to compile information in a visual way. There are a variety of different templates available to users that are grouped under headings like: map your ideas, explore, solve problems, analyse and different perspectives. Exploratree is a simple way to compile information that does not require a user to sign up. It is a great alternative to traditional mind maps done on a whiteboard as it allows the user to save and come back to the diagram. This can be useful for teachers gathering information for students or as a way for a student to submit their work in an assessment task.
Instructions
Exploratree is extremely simple to use and requires minimal knowledge of computers. A user can either create their own thinking guide or create one from scratch. To do this, the user clicks on their preferred option on the homepage, as shown below.

Once a template has been selected, it can be edited by simply clicking the "do it" button at the top of the editing page. To display work, click the "show it" button or one of the share links

Use in Class
Exploratree would be an excellent revision tool for HSC students looking to compare and contrast something. For example, the patterns in nature topic in the preliminary course calls on students to compare and contrast things, and this would be an excellent way to either present information as a small informal assessment task in class or as revision for the end of year exam. This can be done using the compare and contrast template shown below:

Outcomes Covered
8.1 13.1
b) selecting and using appropriate media to present data and information
c) selecting and using appropriate formats to acknowledge sources of information
d) using symbols and formulae to express relationships and using appropriate units for physical quantities
e) using a variety of pictorial representations to show relationships and present information clearly and succinctly
8.3.4.2.1 compare the roles of respiratory, circulatory and excretory systems
8.3.4.2.2 identify and compare the gaseous exchange surfaces in an insect, a fish, a frog and a mammal
8.3.4.2.5 compare open and closed circulatory systems using one vertebrate and one invertebrate as examples
Introduction
Exploratree is a web app which allows the user to create "thinking guides", diagrams or mindmaps to compile information in a visual way. There are a variety of different templates available to users that are grouped under headings like: map your ideas, explore, solve problems, analyse and different perspectives. Exploratree is a simple way to compile information that does not require a user to sign up. It is a great alternative to traditional mind maps done on a whiteboard as it allows the user to save and come back to the diagram. This can be useful for teachers gathering information for students or as a way for a student to submit their work in an assessment task.
Instructions
Exploratree is extremely simple to use and requires minimal knowledge of computers. A user can either create their own thinking guide or create one from scratch. To do this, the user clicks on their preferred option on the homepage, as shown below.
Once a template has been selected, it can be edited by simply clicking the "do it" button at the top of the editing page. To display work, click the "show it" button or one of the share links
Use in Class
Exploratree would be an excellent revision tool for HSC students looking to compare and contrast something. For example, the patterns in nature topic in the preliminary course calls on students to compare and contrast things, and this would be an excellent way to either present information as a small informal assessment task in class or as revision for the end of year exam. This can be done using the compare and contrast template shown below:
Outcomes Covered
8.1 13.1
b) selecting and using appropriate media to present data and information
c) selecting and using appropriate formats to acknowledge sources of information
d) using symbols and formulae to express relationships and using appropriate units for physical quantities
e) using a variety of pictorial representations to show relationships and present information clearly and succinctly
8.3.4.2.1 compare the roles of respiratory, circulatory and excretory systems
8.3.4.2.2 identify and compare the gaseous exchange surfaces in an insect, a fish, a frog and a mammal
8.3.4.2.5 compare open and closed circulatory systems using one vertebrate and one invertebrate as examples
Sunday, 19 April 2015
Socrative
Website (for teachers) and App (for students)
Introduction
Socrative is an app which allows teachers to set quizzes for their students and get real-time results. An excellent tool to use during a revision lesson or at the end of class, socrative is an effective tool as it can be used as an informal assessment for the student or a tool to see how the class is going as a whole.
Instructions
Teachers
Click the website link above and create a free account.
Once on the teacher homepage or dashboard, click the "manage quizzes" tab at the top of the page

Next, click the "Create Quiz" button and begin entering questions

Below is an example of a multiple choice quiz on organelles

Students
Download the app from the link above. Enter your name, room number and begin answering the questions the teacher has set!


The teacher then can view the class results.
Lesson Integration
Socrative is an ideal tool for informal assessment at the start or beginning of a lesson to either look at what the students have learnt during the lesson, what they have retained from last lesson or as a formative tool to see what they already know at the start of a lesson or unit. Following on from my example above, it is a great app for testing HSC students about a particular topic such as cells and microbiology.
When used like this, outcomes covered could include:
7.1.6.3.1 explains why the biochemical processes that occur in cells are related to macroscopic changes in the organism
8.3.1.2. identify cell organelles seen with current light and electron microscopes
Introduction
Socrative is an app which allows teachers to set quizzes for their students and get real-time results. An excellent tool to use during a revision lesson or at the end of class, socrative is an effective tool as it can be used as an informal assessment for the student or a tool to see how the class is going as a whole.
Instructions
Teachers
Click the website link above and create a free account.
Once on the teacher homepage or dashboard, click the "manage quizzes" tab at the top of the page
Below is an example of a multiple choice quiz on organelles
Students
Download the app from the link above. Enter your name, room number and begin answering the questions the teacher has set!
The teacher then can view the class results.
Lesson Integration
Socrative is an ideal tool for informal assessment at the start or beginning of a lesson to either look at what the students have learnt during the lesson, what they have retained from last lesson or as a formative tool to see what they already know at the start of a lesson or unit. Following on from my example above, it is a great app for testing HSC students about a particular topic such as cells and microbiology.
When used like this, outcomes covered could include:
7.1.6.3.1 explains why the biochemical processes that occur in cells are related to macroscopic changes in the organism
8.3.1.2. identify cell organelles seen with current light and electron microscopes
Subscribe to:
Posts (Atom)